

Sample 2 : The line graph shows the consumption of fats between 1971 and 1997
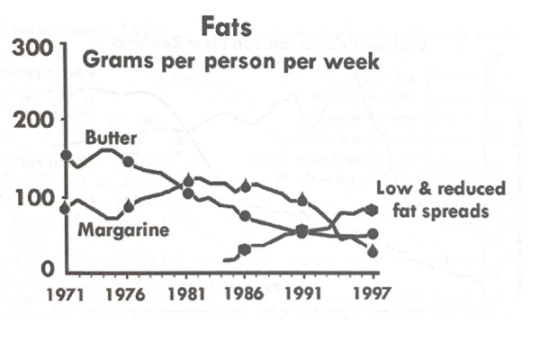
The diagram shows the consumption of fat including butter, margarine and low fat spreads between 1971 and 1997.
Over the period 1071 to 1997 as a whole,there was a slight decline in the consumotion of butter and margarine and a corresponding rise in the consumption of low_fat spreads . Butter was the most popular fat at the beginning of the period, and consumption reached a peak of about 150 grams per person per week in about 1975.Since then ,there has been a steady decline in 1981, the consumption of margarine exceeded that of butter for the first time ,but since 1987 there has been a marked fall in the consumption of margarine, which seems set to continue. Low -fat spreads were introduced in about 1984, and there has been steady increase in their consumption since then, so that by about 1994, they were more popular than butter and margarine.(151 words)
موسسه زبان های خارجه فردای سبز کویر کرمان
ما را در اینستاگرام دنبال کنید
http://www.instagram.com/fskacademy